Projected peak demand growth
NERC’s 2025 assessment outlook for summer peak demand growth. A planning estimate, not a live measurement.
NERC / 2025 ASSESSMENT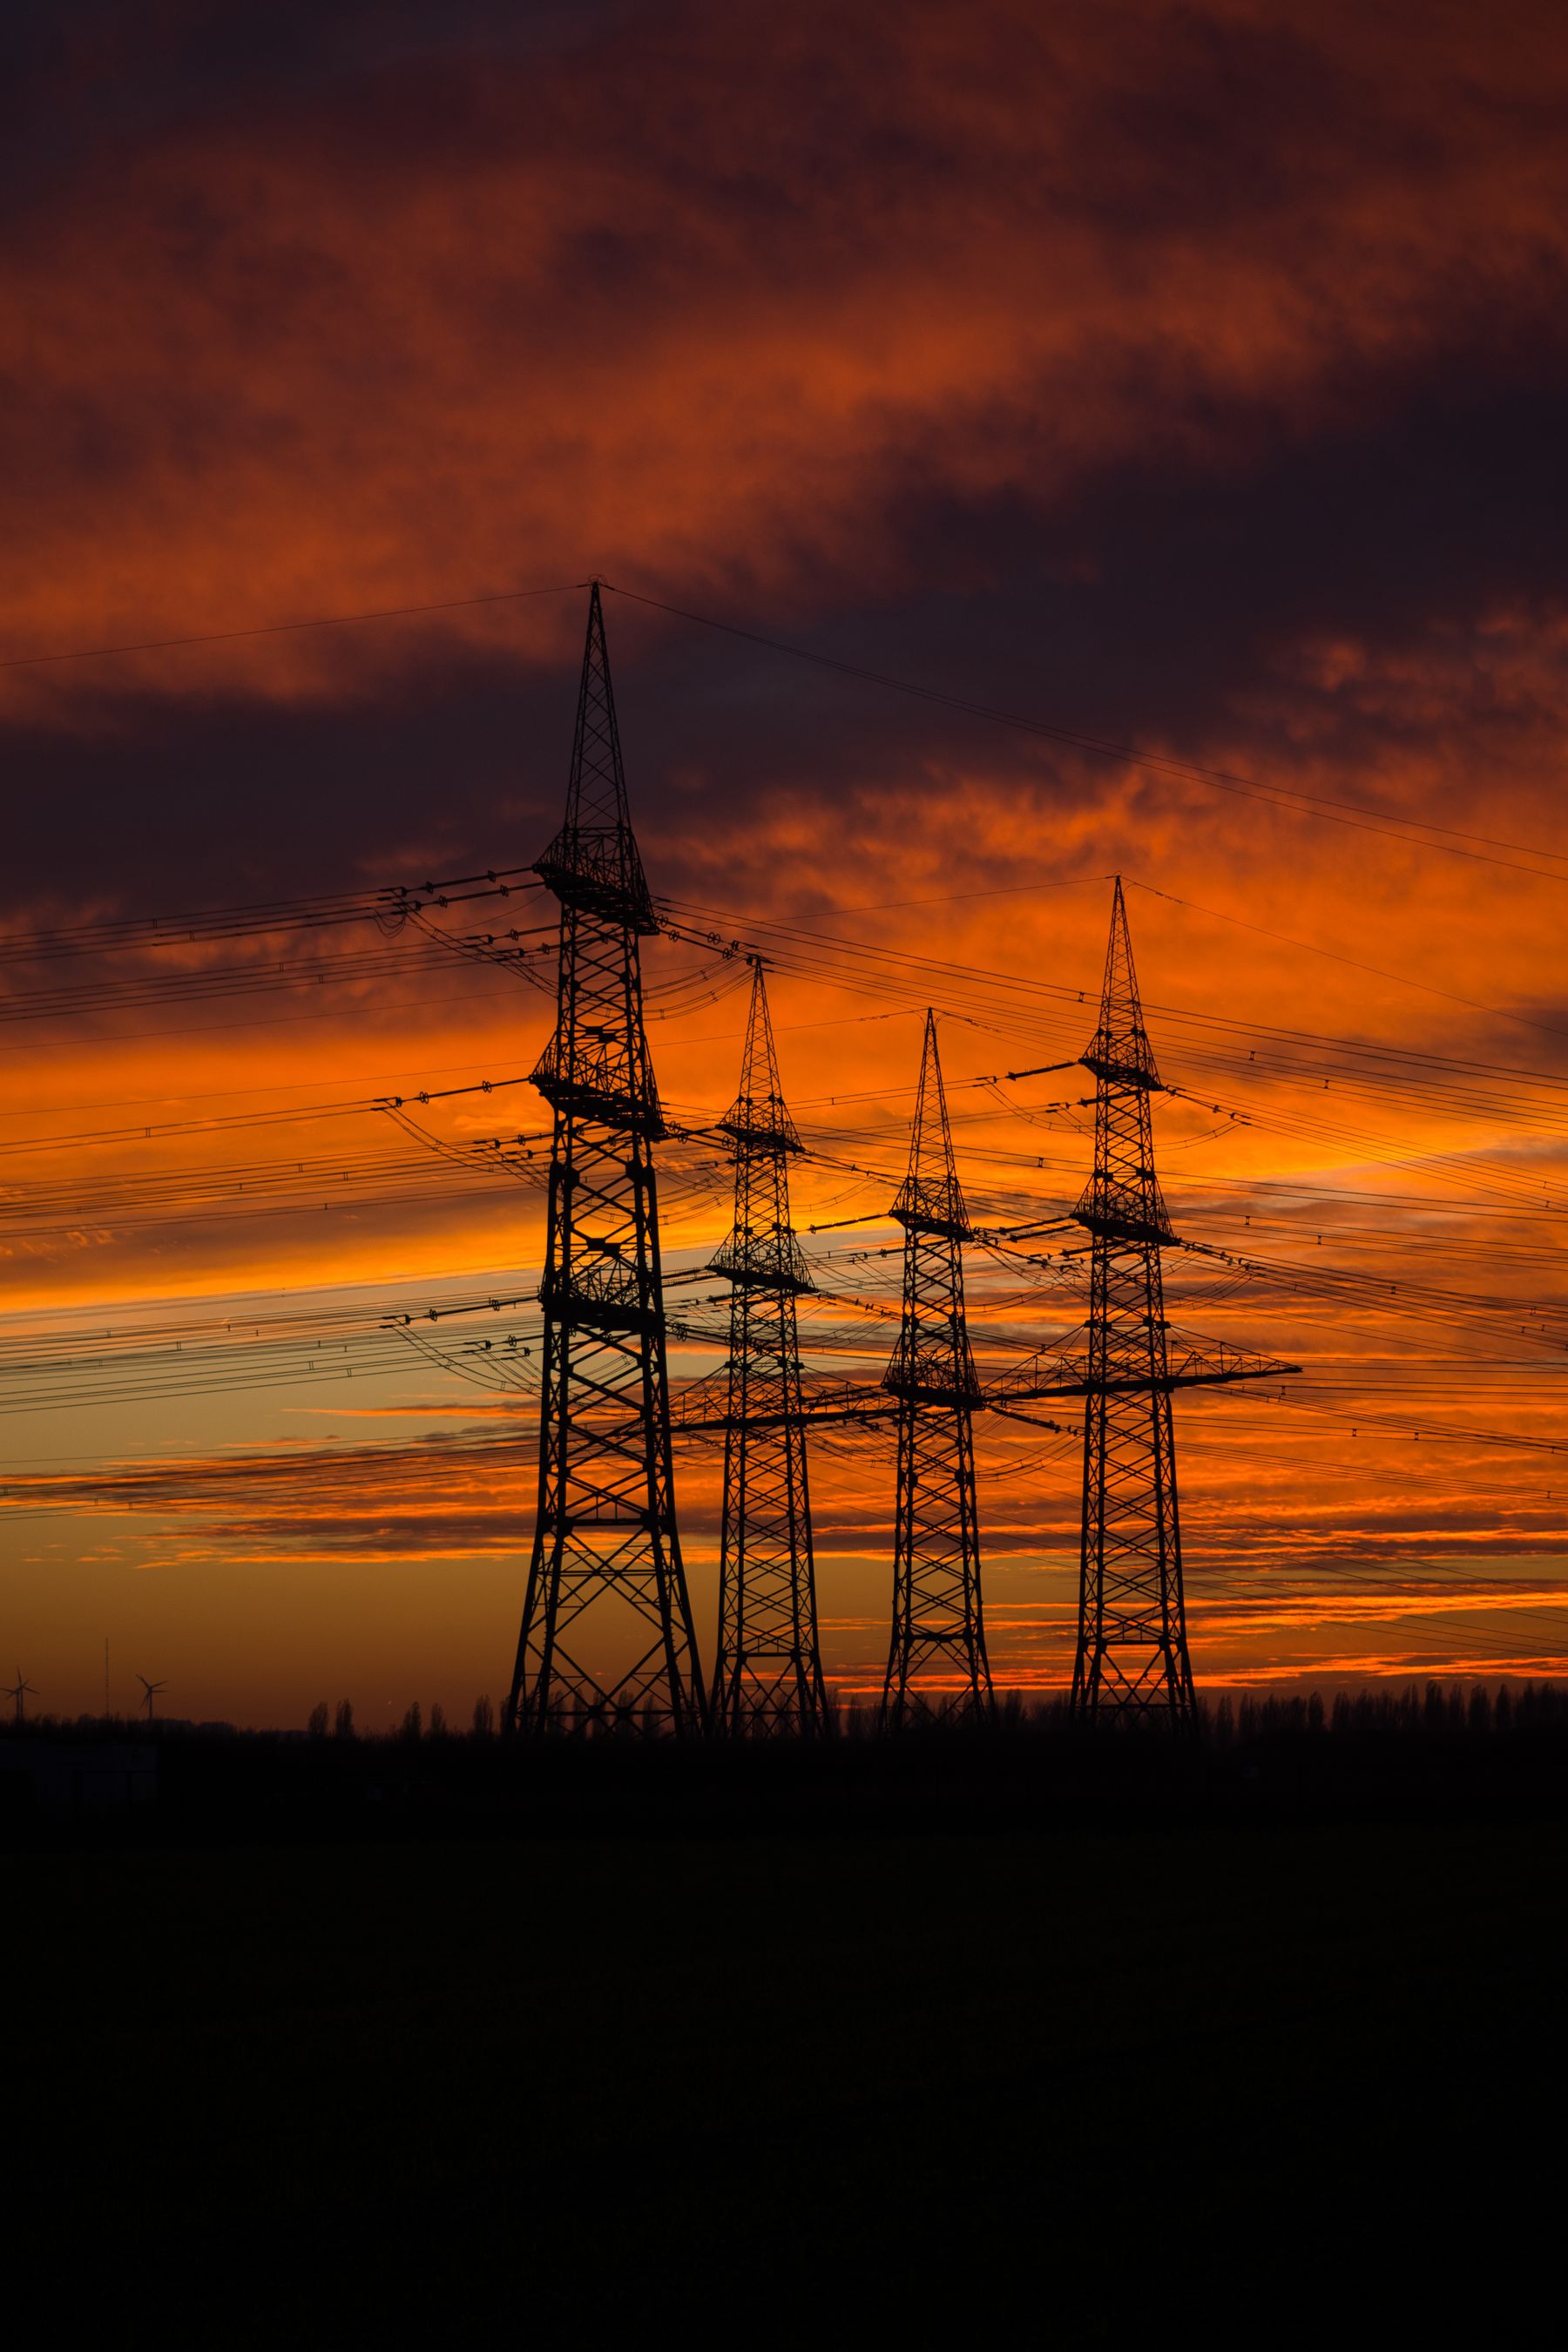
The way we make, move and use electricity is changing.
Understand the bottlenecks—and where your home fits in.
New data centers, manufacturing, electrification and weather-sensitive demand put pressure on a system that develops over decades. Generation is one part of the answer. Delivering it is another.
NERC’s 2025 assessment outlook for summer peak demand growth. A planning estimate, not a live measurement.
NERC / 2025 ASSESSMENTApproximately 1,312 GW of generation and 749 GW of storage in queues at year-end 2025. Proposed projects may change or withdraw.
BERKELEY LAB / QUEUED UP 2026Reported in California’s July 29, 2025 demonstration. Thousands of small contributions can become a meaningful response.
PG&E + EDISON / JULY 2025Explore each stage to see what it does, where delays can emerge, and why a household’s experience depends on the whole journey.
Power plants, solar and wind turn primary energy into electricity. More proposed generation does not automatically mean power can be delivered where it is needed.
New capacity must be built, tested and connected. A queue entry is a proposal, not an operating plant.
High-voltage lines connect generation with regional demand. The right power can exist in the wrong place if transmission capacity is constrained.
Studies, rights of way, permits and construction can take years. A line also needs equipment and protection systems.
Substations switch electricity between parts of the grid and change its voltage for the next stage of the journey.
Transformers, protection, equipment procurement and local planning can become bottlenecks.
Local lines and neighborhood transformers serve streets and buildings. Many everyday customer outages occur here, separate from a regional supply shortage.
Weather, vegetation, equipment condition and changing neighborhood loads affect reliability.
The home can consume, generate, store and sometimes share electricity. That creates flexibility at the edge of the network.
Backup needs compatible equipment and configured circuits. Grid participation needs the right program and operating settings.
Educational diagram. It does not represent a specific circuit, utility project or outage.
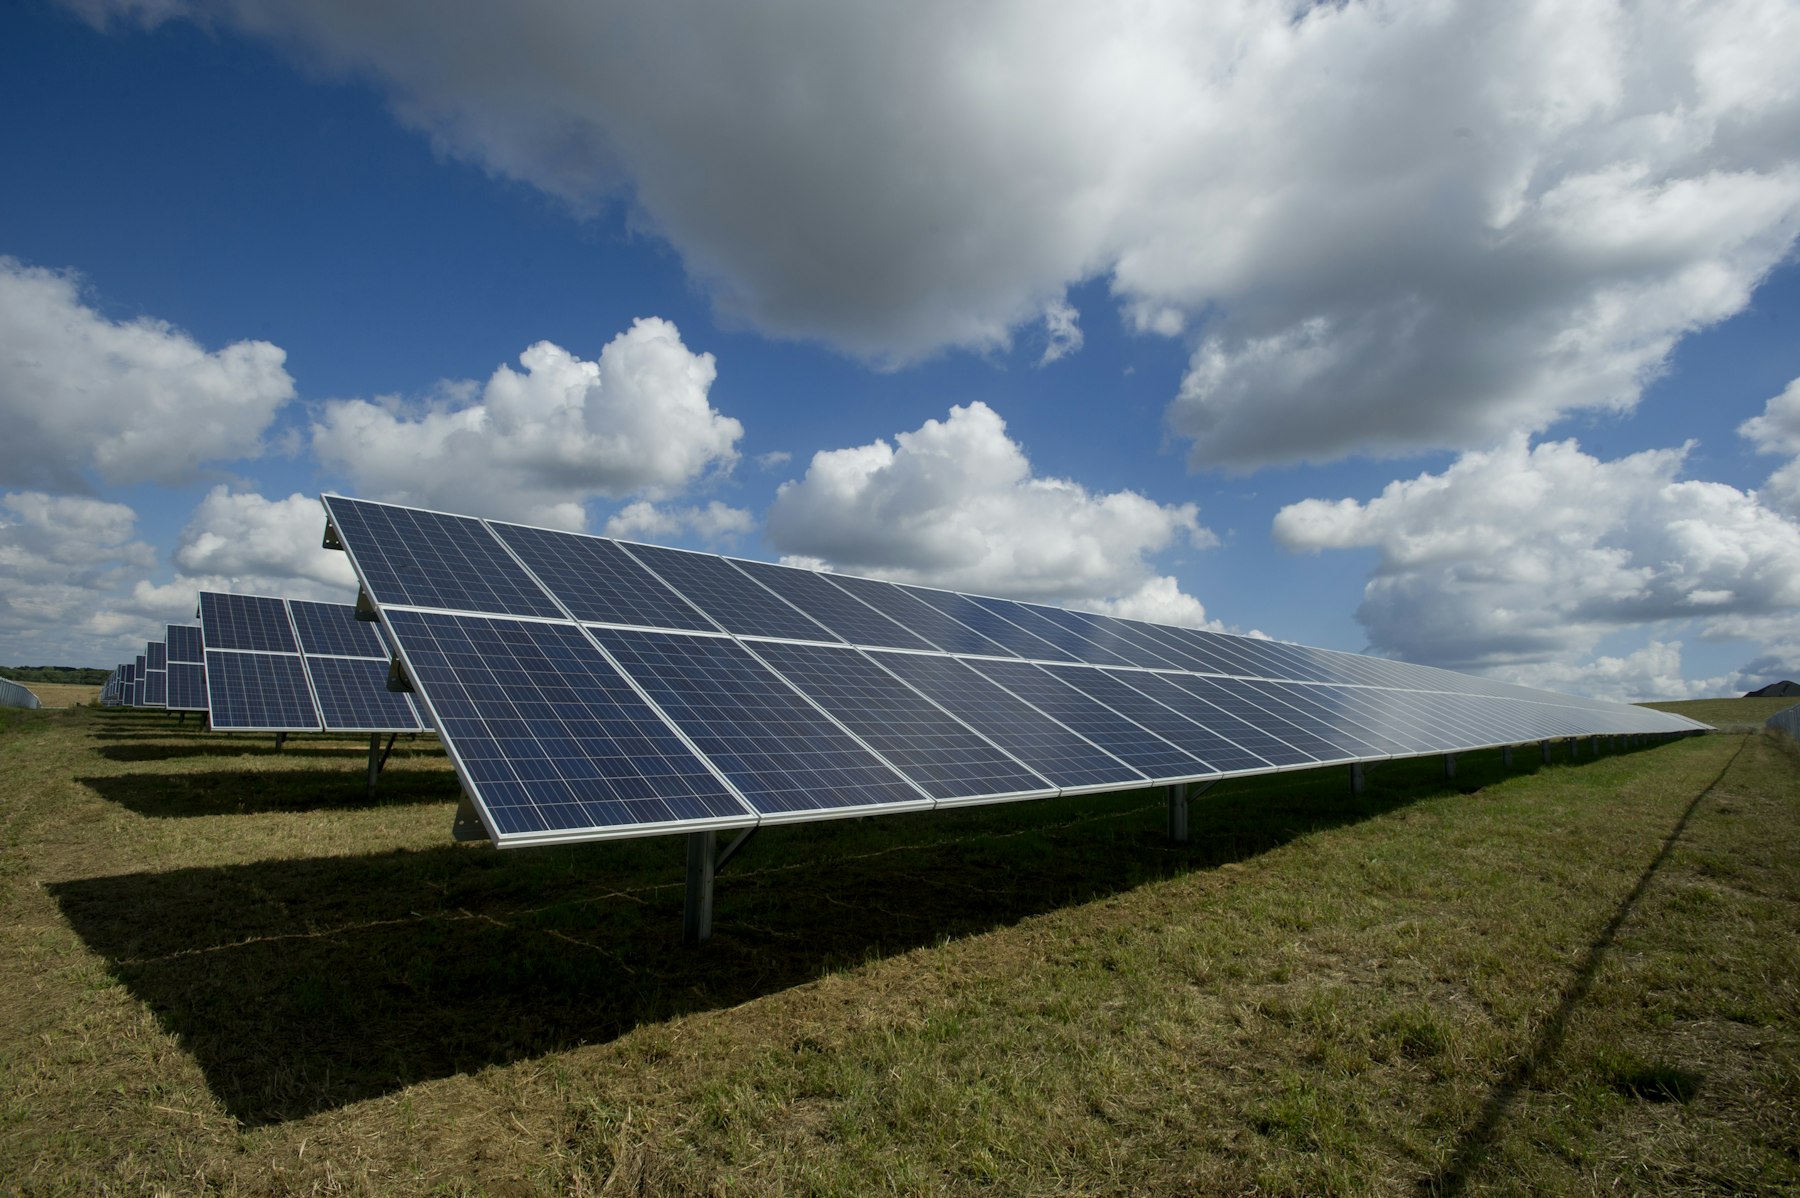
Connection studies, transmission upgrades, substations, permits and equipment procurement develop on different timelines. Even a large pipeline of proposed energy projects cannot bypass every constraint.
Studies establish what a new project needs to connect safely. Some proposals never become operating assets.
Transformers and other specialized equipment require lead time. Upgrades must be coordinated across a working network.
A regional supply improvement does not automatically replace the lines and transformer serving a particular street.
Investment, wildfire mitigation, generation and tariff decisions can affect bills. The source’s example of 40¢/kWh growing about 6.5% annually toward 70¢ by 2035 is a compounding illustration, not an approved future rate.
Build your own bill scenario ↗Local generation, storage and flexible demand can complement the grid. Explore three operating conditions to see the differences.
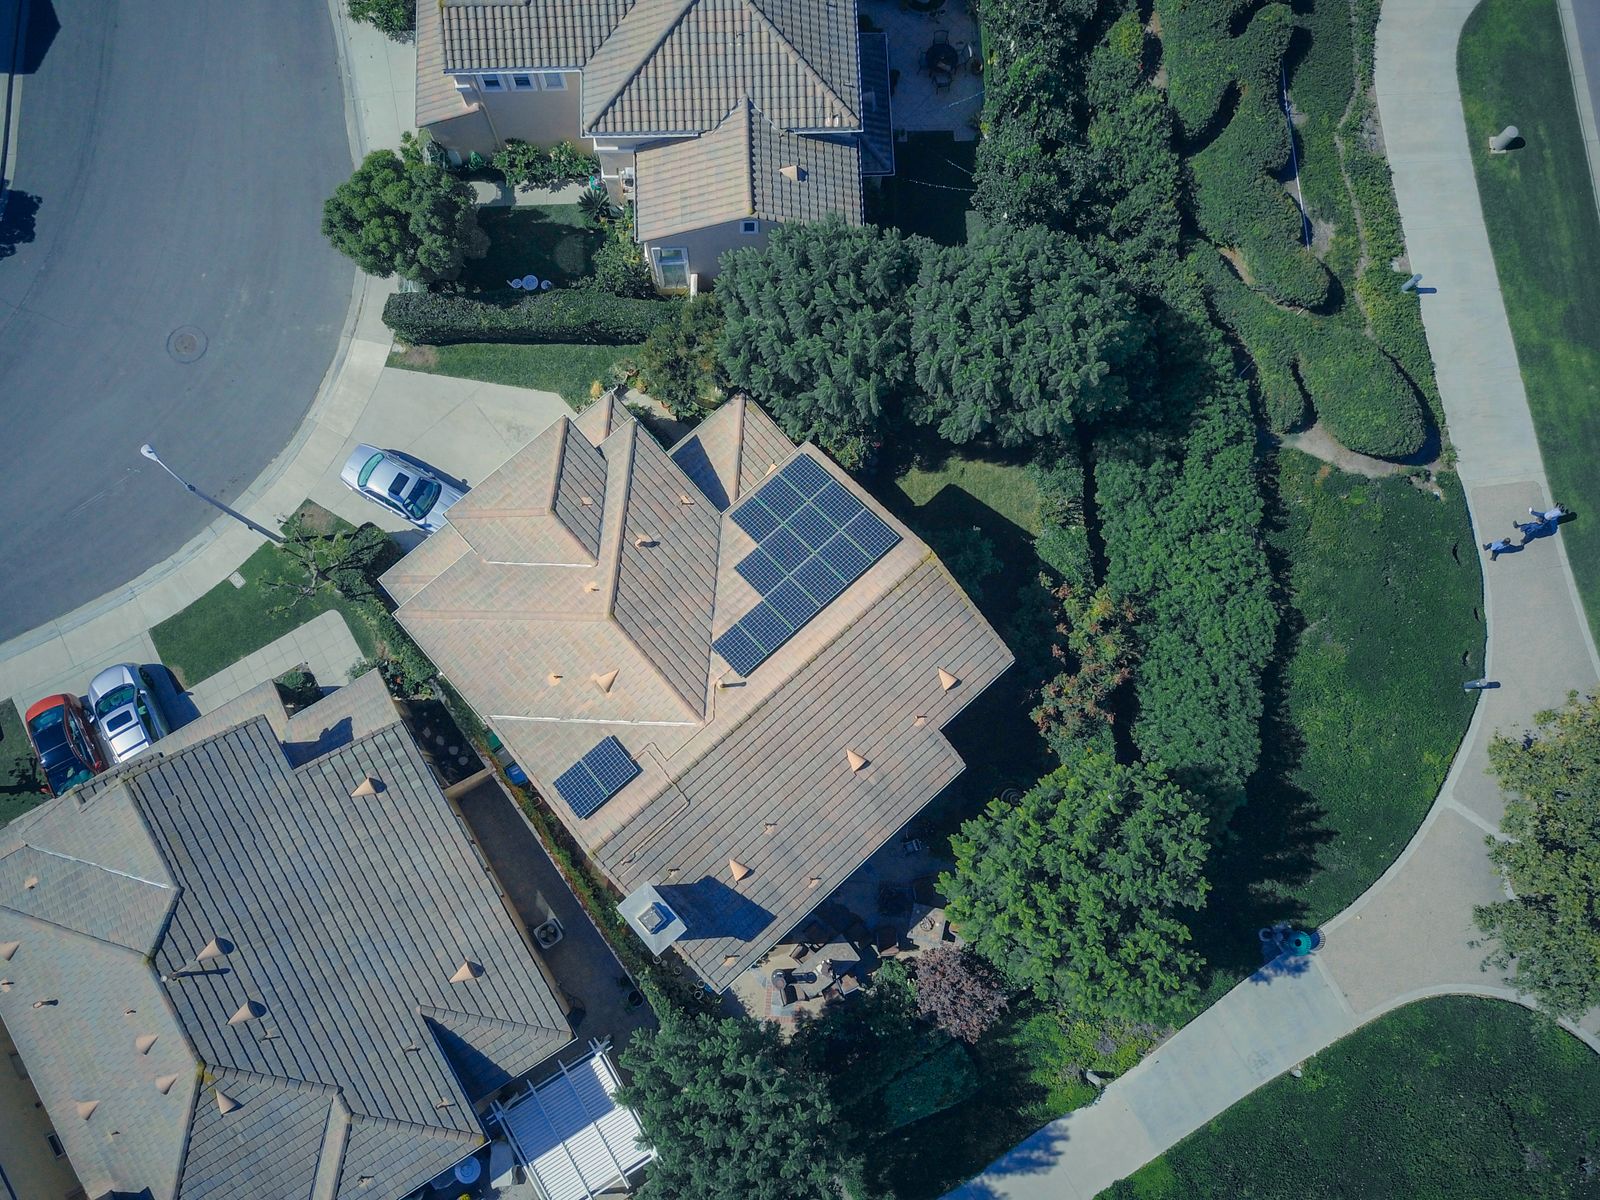
Solar can serve household loads and charge a compatible battery. Extra generation may export under your tariff. The diagram simplifies equipment and energy flow.
Understand VPP events, reserve controls and compensation.
Explore Virtual Power Plants ↗PREPARECompare circuits, runtime and the equipment your household needs.
Plan your backup power ↗Solar and storage can support household resilience and grid flexibility. The right design, program and agreement matter more than a broad promise.
The source’s representative $24,900 system and no-upfront-payment example illustrate an offer structure. Actual equipment, home upgrades, incentives, ongoing payments and coverage must be confirmed in a written proposal.
Published figures, educational models and live observations serve different purposes. Keep those distinctions in view.
Published demand outlook and resource adequacy. A planning assessment, not a prediction that power will fail.
Read the source ↗02 / BERKELEY LABProposed generation and storage seeking connection. Queue capacity is not a forecast of completed construction.
Read the source ↗03 / PG&EReported delivery from coordinated home batteries on July 29, 2025. A demonstration, not a payout promise.
Read the source ↗04 / SOUTHERN CALIFORNIA EDISONA utility account of distributed energy participation and its role during high demand.
Read the source ↗Compare states, inspect model assumptions, and explore how defined stress scenarios change the research model.
Open the interactive atlasBrowse weekly and monthly reports, model inputs, source health, and recorded observations.
Open the report archive